In Santa Rosa's Press Democrat (4/29/06 pA8) is an article written by J. Loven under an Associated Press byline, entitled "Bush opposes tax on oil profits." Loven writes, "President Bush said Friday that taxing enormous oil industry profits is not the way to calm Americans' anxieties about pain at the gas pump, and that his 'inclinations and instincts' are that major oil companies are not intentionally overcharging drivers."
Now this is a bit hard to swallow seeing as oil profits have risen dramatically--one figure touts a 75% increase in the last year or so. This is a figure that runs into the billions of dollars, and it is not showing signs of tapering off. Terence O'Hara, writing for theWashington Post (8/28/05; P D01), says, "By most familiar comparisons, the $9.92 billion profit earned by Exxon Mobil Corp. in just three months is almost unimaginable. "
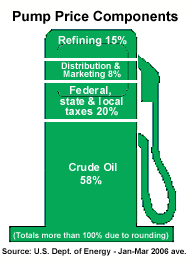
So, where does this $9.2 billion come from? I decided to check out the websites of these companies, and ran across the ConocoPhillips.com site: www.conocophillips.com/newsroom/other_resources/energyanswers/oil_profits.htmOn this site is an explanation of where your gas money goes, along with a cute graphic that is produced by the US Dept. of Energy. It is misleading, and I will show you why.
Let's use the figures on the graphic, and let us also assume a $3.10 price for gasoline at the pump. Of this $3.10 cost, the 58% crude oil cost=$1.80. The 20% federal, state, and local taxes=$0.62. The 8% marketing and distribution cost=$0.25. The 15% refining cost=$0.46. The grand total of these percentages=$3.13. Right away, I thought something was wrong. The oil companies do not sell at a $0.03/gallon loss, not if they hope to post record profits. Reading the graphic a bit more carefully, I see that those percentages total 101%, due to rounding off the figures. This accounts for the 3 cent difference, but is the least of the problems with this graphic.
Looking again at the ConocoPhillips website, I read that they make a profit of $0.09 a gallon. It is not surprising that this figure is nowhere included in the graphic. If I use their statistics, a base price of $3.10/gallon at the pump, I come up with a figure that shows a loss of 3 cents a gallon, yet the company is able to pull 9 cents a gallon profit from every transaction. From which category listed in the graphic does this money come from? The US Department of Energy has deliberately obscured the graph in two ways. Checking the figures, I discovered another serious error in math.
At 9 cents a gallon, it would take the sale of over 9 billion gallons of gas to equal $1 billion in profit, and the figures show profits larger by an order of magnitude. A profit of $9.2 billion, posted by Exxon/Mobile at approximately the same percentage of profit, would require the sale of 100 billion gallons of gas, oil, and other petroleum products in a three-month period. This is, of course, impossible. At the turn of the 20th century, the world only had 3-4 trillion gallons of oil anywhere. It has taken us 100+ years to go through the first trillion. This tells me someone is lying about the source of the oil profits, and US Department of Energy is complicit.
1 comment:
Hey, I thought you were a philosophy major!!
Post a Comment